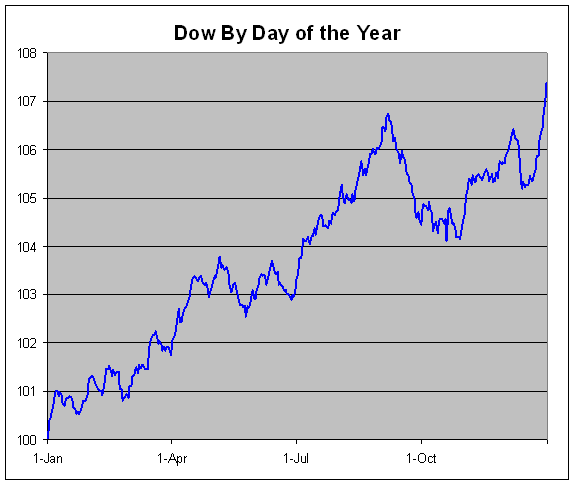
We’re coming up on what has historically been the weakest time of the year for the stock market. I took all 118 years of the Dow and crunched them into one average year (setting 100 for January 1). Here’s what it looks like:
The Dow has historically peaked on September 6, a Saturday this year, and fallen 2.43% by October 29. That’s equal to about one-third of the Dow’s annual capital gain.
I should caution against reading too much into these seasonal effects, and especially on acting on them. Remember that we’re talking about averages that come from 12 decades’ worth of data. In any one year, a drop of 2.43% over eight weeks would barely be noticed.
 The more important lesson is that summer is usually a good time for
stocks. Once summer ends, there’s been a natural energy to take profits.
That could certainly happen again this year. But that historic effect
doesn’t last long, and the market soon rallies again as winter
approaches.
The more important lesson is that summer is usually a good time for
stocks. Once summer ends, there’s been a natural energy to take profits.
That could certainly happen again this year. But that historic effect
doesn’t last long, and the market soon rallies again as winter
approaches. The rally usually comes in November and lasts, if it does last, until around May.
No comments:
Post a Comment